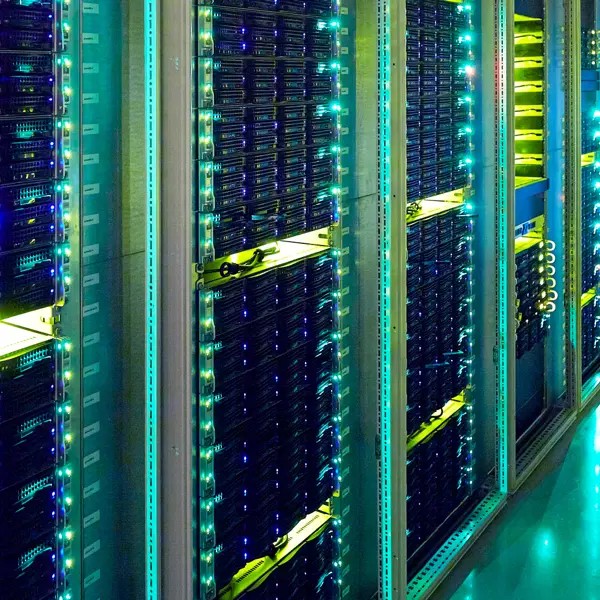
Chalmers e-Commons
Chalmers e-Commons is the gateway to a collection of local, national, and international digital expert functions and resources. Researchers, research groups and research infrastructures at Chalmers can turn to e-Commons for support in making large-scale computing calculations and analyses, and with managing research data throughout its life cycle - from collecting, storing, and handling of data, to analysis and publication of data.
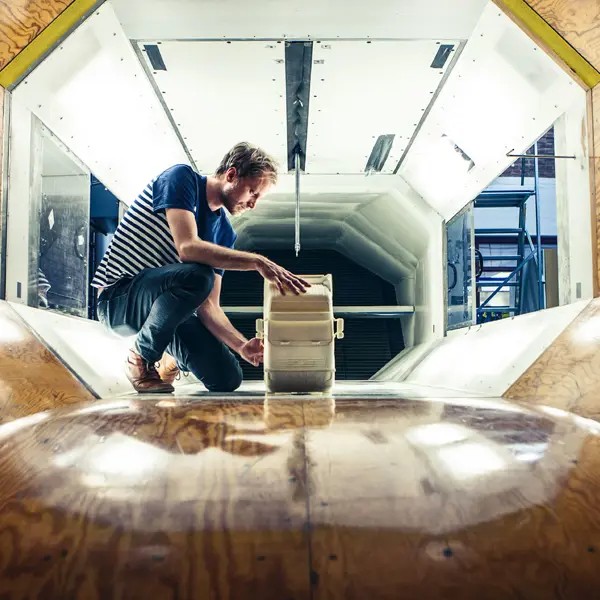
Chalmers Laboratory of Fluids and Thermal Science
The Chalmers laboratory of fluids and thermal sciences is a Chalmers infrastructure hosting a world-class lab with a complete set of hardware resources for leading-edge experimental research in fluid dynamics and heat transfer.
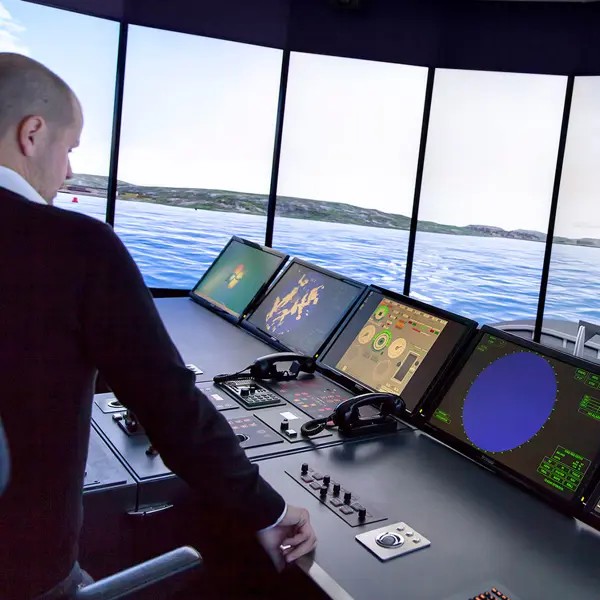
Chalmers Maritime Simulators
The Lindholmen campus has the most comprehensive simulation equipment for training and research in maritime operations. There are a number of different simulators here representing different parts of a vessel and functions on shore.
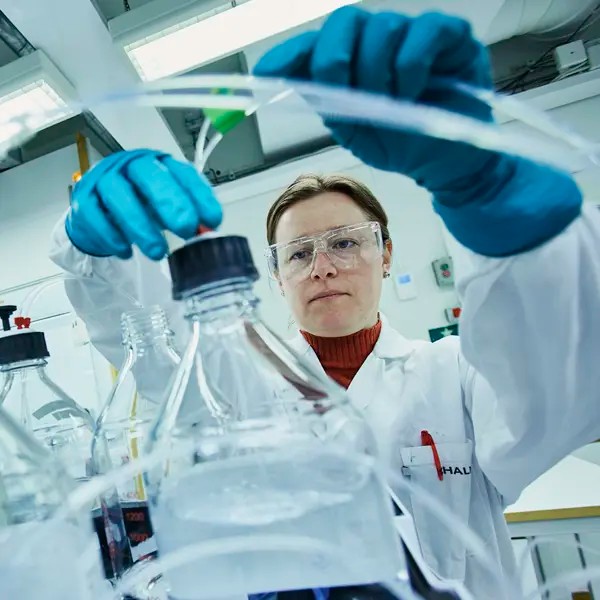
Chalmers Mass Spectrometry Infrastructure
The Chalmers Mass Spectrometry Infrastructure (CMSI) is a Chalmers infrastructure with the goal of providing cutting edge and efficient quantitative mass spectrometry and structural identification analyses for researchers at Chalmers and beyond.
Chalmers Materials Analysis Laboratory
Chalmers Materials Analysis Laboratory (CMAL) is a research and user facility providing basic and state-of-the-art instruments with relevance to materials science. It is our vision that the multitude of instruments, professional technical support staff and an excellent research environment will provide unique possibilities for conducting world-class materials research. The lab offers a broad park of instruments and tools, primarily in the fields of electron microscopy, X-ray diffraction, optical microscopy and mass spectrometry.
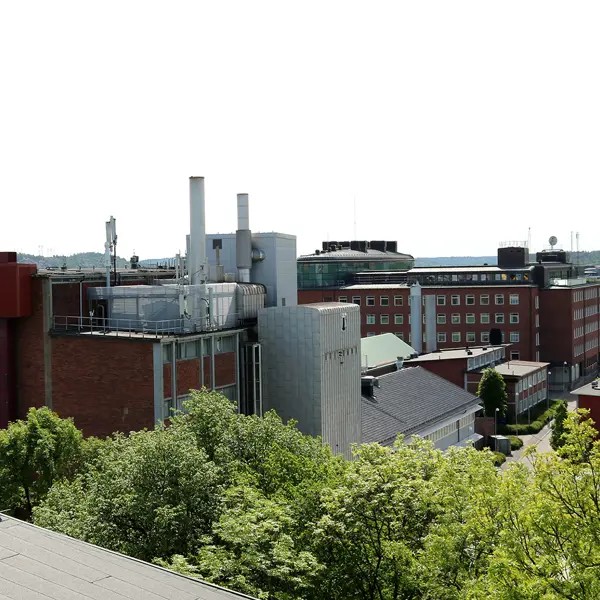
Chalmers Power Central
The Chalmers Power Central (CPC) is an advanced research facility focusing on carbon capture and biomass gasification. This section outlines the ideas and the history behind the unique research facility.
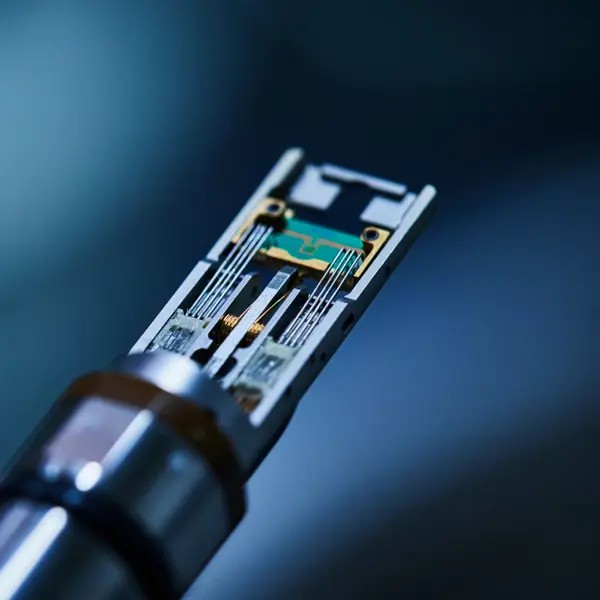
Chemical Imaging
A research infrastructure with a primary focus on high lateral resolution imaging mass spectrometry. The infrastructure offers a wide range of tools for analytical questions within materials science, geoscience and life science. The multimodal imaging capabilities makes CII unique in that we have tools and competence for both MALDI and TOF-SIMS.

Computational Systems Biology Infrastructure
Computational Systems Biology Infrastructure, CSB, is a national research support infrastructure aiming to establishment of a computational framework for management and usage of genome-scale metabolic models (GEMs), as well as providing expert support in computational biology and bioinformatics for nationally prioritised research projects.
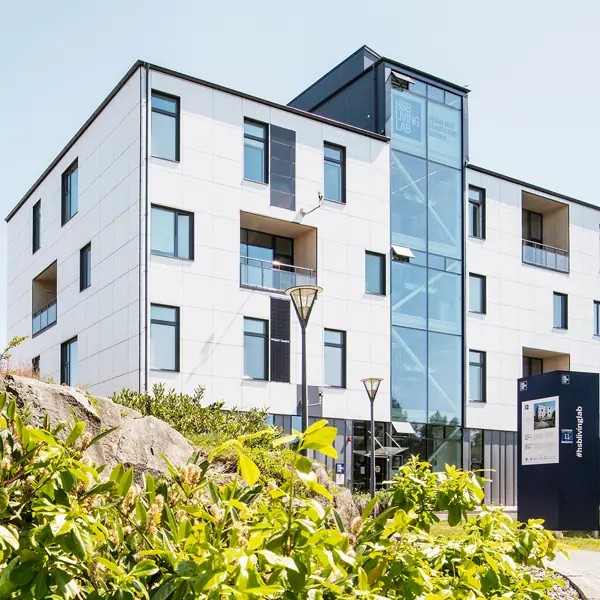
HSB Living lab
HSB Living Lab is a unique research and collaboration project between Chalmers and 11 other partners in the built environment sector. The Living Lab is a residential building with 29 apartments on the university campus in Gothenburg.
Infravis
National research infrastructure for data visualization. The 9 partner universities are coordinated by Chalmers University of Technology.
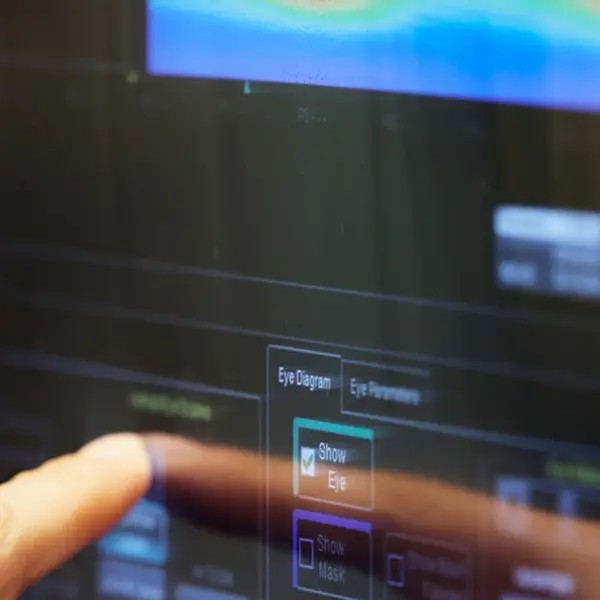
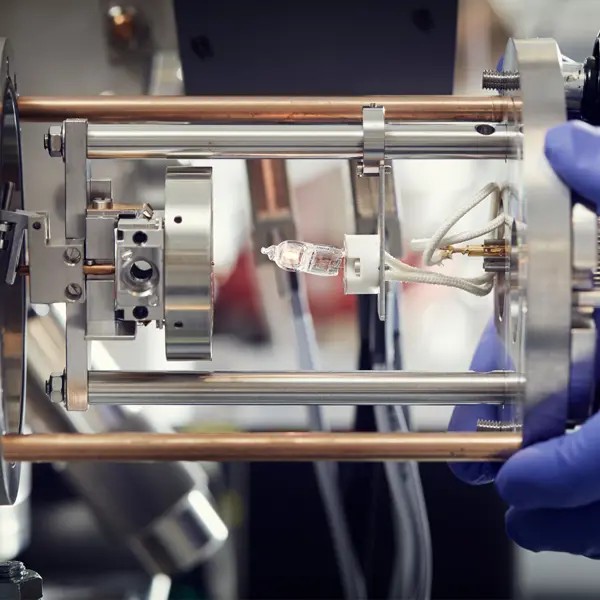
Kollberg laboratory
The Kollberg Laboratory, an open research infrastructure for microwave and terahertz characterization, is a unique laboratory for the development of technology in the hard to reach terahertz frequency range, for example frequencies of the order of a trillion cycles per second as well as for advanced communication and sensing systems in the microwave range. The infrastructure enables research with applications in space exploration, future wireless communications and radar sensors, for example in autonomous vehicles.
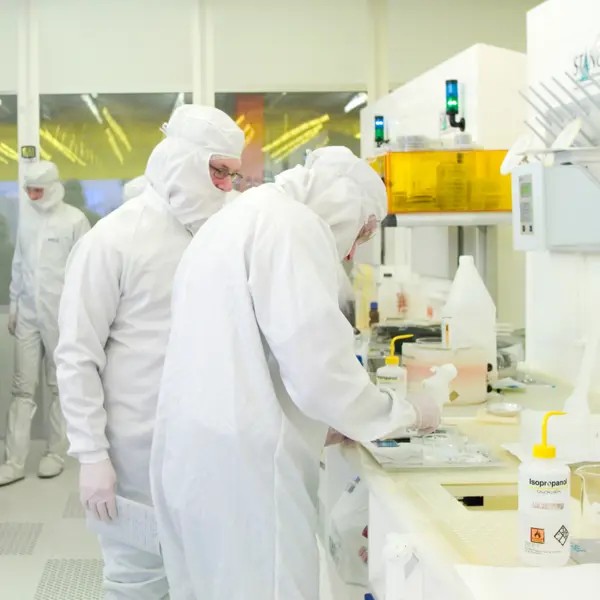
Myfab Chalmers
The Nanofabrication Laboratory is a clean room facility for research and development in micro and nanotechnology. You will find a wide range of equipment for developing and testing new ideas on a micro and nano scale here. The laboratory is part of the national research infrastructure Myfab, which is coordinated by Chalmers.
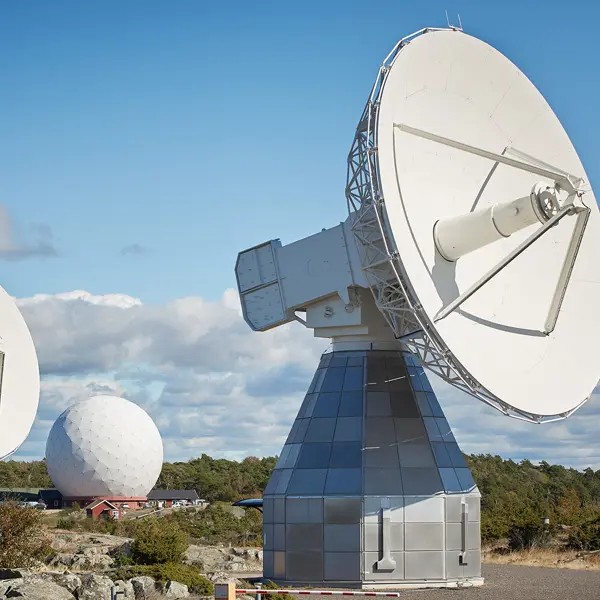
Onsala Space Observatory
Onsala Space Observatory is the Swedish national infrastructure for radio astronomy.
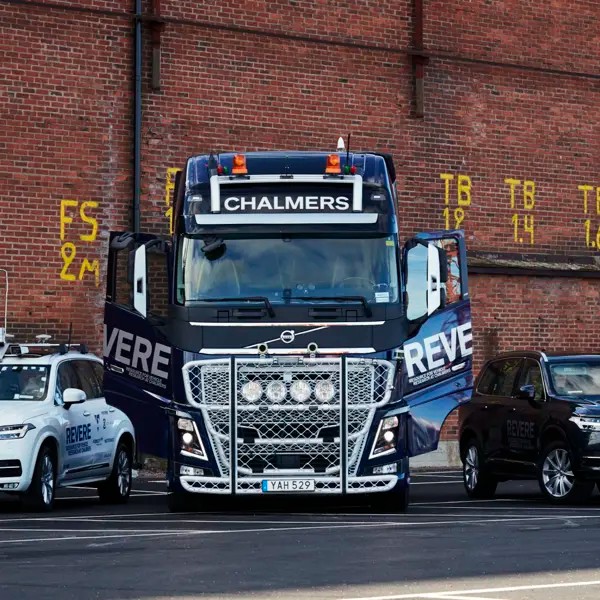
Revere
The aim of REVERE is to enable development, testing, verification and demonstration of theoretical models, algorithms and technologies using real vehicles in real or conditioned traffic environments.
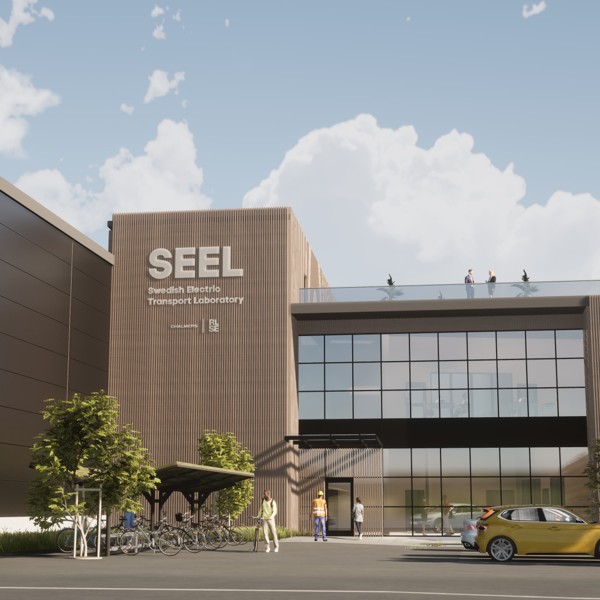
SEEL and Chalmers Fuel Cell Laboratory
At Seel, Swedish Electric Transport Laboratory academia, institutes, and industry will be able to test vehicles and components for electromobility on a full scale. The facilities are placed in Säve, Borås and Nykvarn. Seel Säve also houses Chalmers' own fuel cell lab. A new laboratory for research and testing of future fuel cell and hydrogen technologies.